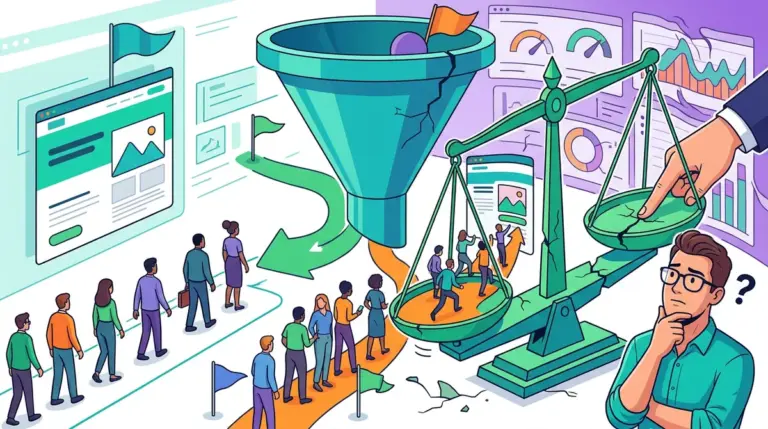
Ending an A/B test prematurely is one of the most expensive mistakes a growth team can make. It leads to "imaginary lifts"—statistical noise that looks like a 15% conversion increase on Tuesday but vanishes by the following month. Conversely, running a test too long wastes traffic on an inferior variant, stalling your roadmap and costing the business potential revenue. Finding the "Goldilocks zone" for test duration isn't about intuition; it is a calculation of statistical power, sample size requirements, and the natural rhythm of your business cycle.
The Mathematical Minimum for Statistical Validity
Before a test even goes live, you must determine the required sample size. This isn't a moving target you decide on the fly. It is dictated by three primary levers: your baseline conversion rate, the Minimum Detectable Effect (MDE) you are hunting for, and your desired statistical power.
Baseline Conversion Rate: If your landing page converts at 2%, moving that needle to 2.2% (a 10% relative lift) requires significantly more data than moving a 20% conversion rate to 22%. The lower your baseline, the more traffic you need to filter out random variance.
Minimum Detectable Effect (MDE): This is the smallest improvement that makes the change worth implementing from a business perspective. If you set a tight MDE of 2%, you are telling the math that you want to be able to spot very subtle wins. This requires a massive sample. If you set a loose MDE of 10%, you can conclude the test faster, but you risk missing smaller, incremental gains that could compound over time.
Statistical Power: Usually set at 80%, this is the probability that your test will actually detect an effect if there is one to be found. Lowering this increases the risk of a Type II error (a false negative), where you kill a winning variation because the test wasn't sensitive enough to "see" the win.
The Influence of the Full Business Cycle
Statistical significance is a mathematical threshold, but it does not account for human behavior. Most businesses operate on a seven-day cycle. A user who visits your site on a frantic Monday morning has a different intent and psychological profile than a user browsing on a relaxed Sunday afternoon. If you run a test for only four days, even if you hit your required sample size, your data is biased toward "early-week behavior."
Standard practice dictates running tests in full-week increments. Two weeks is the industry baseline for most mid-to-high traffic sites. This allows you to capture two full cycles of weekday and weekend traffic, smoothing out any anomalies like a mid-week holiday, a one-day flash sale, or a specific email blast that might temporarily skew the audience composition.
- Low Traffic Sites: May need 4 to 8 weeks to reach significance. If a test takes longer than 8 weeks, the risk of "cookie churn" increases, where users clear their browser data and reappear as new visitors, polluting the test buckets.
- High Traffic Sites: Might reach statistical significance in 48 hours, but should still wait at least 7 days to account for the weekly cycle.
- B2B Funnels: Often require longer durations because the sales cycle is longer. A user might see the A/B test on day 1 but not convert until day 10.
Warning: Avoid the "Peeking Problem." If you check your results daily and stop the test the moment the p-value hits 0.05, you are significantly increasing your False Positive Rate. Statistical significance is designed to be calculated once the predetermined sample size is reached, not as a continuous monitoring tool.
Avoiding the False Positive Trap
The urge to "call it" early is strongest when a variant shows a massive 30% lift in the first three days. This is almost always regression to the mean. Early data is volatile. In a small sample, a single "whale" purchase or a handful of lucky conversions can wildly inflate the conversion rate. As the sample size grows, these outliers are diluted, and the conversion rate usually settles back toward the true average.
To mitigate this, use a fixed-horizon testing approach. Calculate your sample size using an A/B test calculator before you start. Do not stop the test until that number of visitors has passed through each variant, regardless of what the "probability to outperform" looks like in your dashboard on day four.
Calculating the Opportunity Cost of a Losing Variant
There is a legitimate argument for stopping tests early: the cost of the "losing" bucket. If variant B is performing 40% worse than the control, every visitor sent to variant B is lost revenue. In high-stakes environments, you can use Bayesian testing frameworks or Multi-Armed Bandit (MAB) algorithms. MABs automatically shift traffic toward the winning variant in real-time, minimizing the "regret" or lost revenue during the testing phase. However, for standard landing page optimization where you want clean data for long-term learnings, the fixed-horizon frequentist approach remains the gold standard for accuracy.
When to Kill a Test Early
While you should generally stick to your calculated duration, there are specific "emergency" triggers for stopping a test:
Technical Breakage: If one variant has a 0% conversion rate or a massive spike in 404 errors, the test is compromised. Stop it, fix the bug, and restart from scratch. Never try to "salvage" data from a broken variant.
Extreme Negative Impact: If the test variant is causing a catastrophic drop in revenue that exceeds the business's risk tolerance (e.g., a 50% drop in checkout completions over a statistically significant volume), the test should be terminated to protect the bottom line.
Building a Repeatable Testing Roadmap
To scale your CRO efforts, you need a standardized protocol for duration. This removes the emotional element from the decision-making process. Start by auditing your traffic to see how long it takes to get 300–500 conversions per variant; for most sites, this is the floor for reliable data. If it takes you six months to get that many conversions, your testing energy is better spent on "big swing" changes rather than micro-copy tweaks, as the latter will never reach significance in a reasonable timeframe.
Focus on high-impact pages like the checkout, pricing page, or primary lead magnets. These areas generate data faster, allowing for shorter test cycles and more frequent iterations. By tightening your testing window to the mathematical minimum plus one full business cycle, you maximize the number of "wins" you can implement per year.
A/B Testing Duration FAQ
Is 7 days long enough for an A/B test?
Only if you have reached your required sample size within those 7 days. For high-traffic sites, 7 days is a good minimum to capture a full weekly business cycle, but it is not a universal rule. Always calculate sample size requirements first.
What happens if I run a test for too long?
Running a test for more than 6–8 weeks introduces "sample pollution." Cookies expire or are cleared, and external market factors (like a competitor's new campaign) can change user behavior, making your initial baseline irrelevant.
Can I stop a test once it reaches 95% significance?
Not necessarily. You must also reach your pre-calculated sample size. Significance can fluctuate wildly early in a test (the "peeking problem"). If you stop at the first moment it hits 95%, you are likely capturing a false positive.
Does traffic volume affect how long I should test?
Yes. High-traffic sites can reach statistical power in days, while low-traffic sites may take weeks. If your traffic is too low to reach significance within 8 weeks, consider using qualitative testing or "bold" changes that produce a larger, easier-to-detect effect. If your traffic is too low to reach significance within 8 weeks, consider using qualitative testing or "bold" changes that produce a larger, easier-to-detect effect, or revisit what to test first.