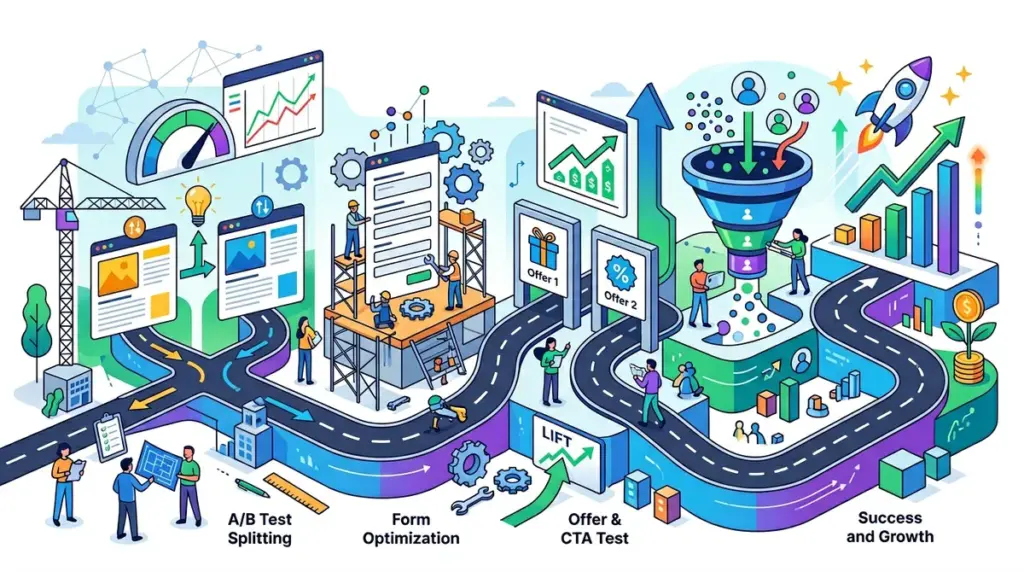
Most conversion rate optimization efforts fail not because the ideas are bad, but because the sequence is wrong. A disorganized list of "best practices" is not a roadmap; it is a wishlist. Without a structured testing framework, you risk burning traffic on low-impact changes while ignoring the friction points that are actually killing your margins. A professional CRO roadmap is a risk-mitigation tool designed to prioritize experiments based on their potential to drive revenue and the technical effort required to deploy them.
Auditing the Funnel for Data-Driven Friction
Before writing a single hypothesis, you must identify where users are abandoning the journey. Start with a quantitative audit using GA4 Funnel Explorations. Look for the "cliff"—the specific step where the drop-off rate exceeds the industry average. For lead generation, this is often the transition from the landing page to the form; for e-commerce, it is usually the jump from "Add to Cart" to "Begin Checkout."
Best for: Identifying high-volume leakage points that offer the fastest ROI on testing resources.
Once you have the "where," use qualitative tools to find the "why." Heatmaps and session recordings reveal if users are clicking non-clickable elements or if they are hesitating at specific form fields. If users are scrolling past your primary CTA without a pause, your value proposition is likely buried or lacks immediate relevance. If they hover over a "Required" field for five seconds before exiting, your form friction is too high.
Constructing a Validated Hypothesis
A weak hypothesis leads to inconclusive results. "Changing the button to red might get more clicks" is a guess. A structured hypothesis follows a strict logic: If [we make this change], then [this metric will move], because [this psychological or functional barrier is removed].
For example: "If we move the lead form above the fold on mobile devices, then the form completion rate will increase by 12%, because users are currently dropping off before reaching the CTA due to excessive scrolling." This format forces you to justify every test with an observation, making it easier to defend the roadmap to stakeholders and ensuring that even a "failed" test provides a learning outcome about user behavior.
The PIE Prioritization Framework
You cannot test everything at once. To maximize the velocity of your testing program, rank every hypothesis using the PIE framework. This prevents "shiny object syndrome" from hijacking your development queue.
- Potential: How much improvement can be made on this page? A page with a 1% conversion rate has more "potential" for lift than one already converting at 15%.
- Importance: How valuable is the traffic to this page? Testing a high-intent checkout page is more important than testing a low-traffic "About Us" page.
- Ease: How difficult is it to implement this test? A copy change is an "Ease 10," while a custom-coded multi-step calculator might be an "Ease 2."
Calculate the average score for each hypothesis. High-score items move to the top of the roadmap. This ensures you are constantly running tests that offer the highest possible return for the lowest technical investment.
Determining Sample Size and Test Duration
Running a test for three days and declaring a winner because the line graph looks good is a recipe for false positives. You must calculate your required sample size before the test begins to ensure statistical significance, typically aiming for a 95% confidence level. Use a pre-test calculator to determine how many conversions you need per variation to detect a specific Minimum Detectable Effect (MDE).
Pro Tip: Never stop a test as soon as it hits significance. External variables like "day-of-the-week effect" or a sudden influx of low-quality social media traffic can skew results. Run every test for at least two full business cycles (usually 14 days) to account for fluctuations in user intent across the week.
Managing the Testing Queue and Velocity
Testing velocity—the number of experiments you run per month—is the primary driver of CRO success. However, you must avoid "test pollution," where two simultaneous experiments on the same page make it impossible to tell which change caused the lift. To maintain a high velocity, segment your roadmap by funnel stage. You can safely run a headline test on a top-of-funnel landing page while simultaneously testing a one-click checkout feature at the bottom of the funnel, as these touchpoints are sufficiently isolated.
Documenting and Iterating on Results
The roadmap is a living document. Every completed test must be archived in a central repository that includes the original hypothesis, the visual variations, the raw data, and the final takeaway. If a test fails to reach significance, it is not a loss; it is evidence that the specific variable tested is not a primary driver of user behavior for that segment. Use these insights to refine the next round of hypotheses. For instance, if a "social proof" test fails, your audience may be more motivated by "risk reversal" (e.g., money-back guarantees), and your roadmap should pivot accordingly.
Executing Your First High-Impact Experiment
Stop analyzing and start deploying. Begin by identifying your highest-traffic landing page and looking for the single most obvious point of friction. Use the PIE framework to validate that it is an "easy win," set your tracking parameters in your testing tool, and let the data run for a minimum of two weeks. The goal is to build a repeatable process where every design and copy change is backed by a statistical mandate rather than a subjective opinion.
Frequently Asked Questions
How much traffic do I need to start CRO testing?
While you can run qualitative tests (like user testing) with any amount of traffic, for A/B testing to be statistically valid, you generally need at least 500 to 1,000 conversions per month. If your traffic is lower, focus on high-impact "radical redesigns" rather than small incremental tweaks.
What is the most common mistake in a CRO roadmap?
Testing too many variables at once in a single variation (multivariate testing) without having the massive traffic volume required to support it. This leads to "noise" rather than clear, actionable insights.
How long should a typical A/B test run?
Most tests should run for 14 to 28 days. This captures a full range of user behavior across different days of the week and pay cycles, ensuring that the "winner" isn't just a result of a temporary traffic anomaly.
Should I test my mobile and desktop users separately?
Yes. User intent and physical interaction patterns differ significantly between devices. A change that works on desktop (like an expanded form) may fail miserably on mobile due to screen real estate constraints.