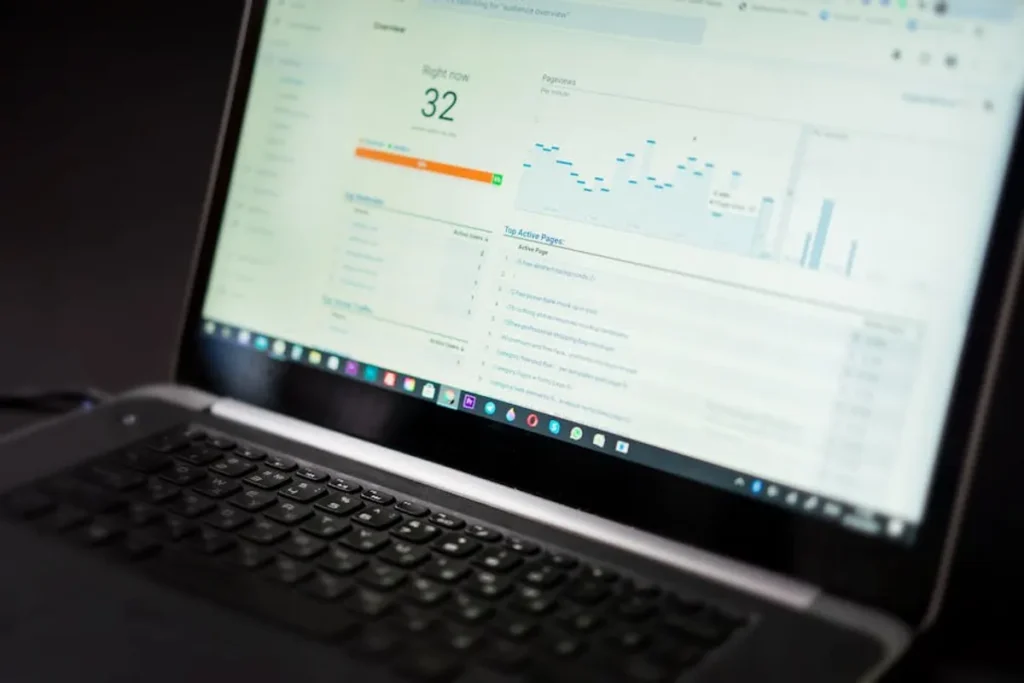
Understanding how users interact with your content extends beyond simple page views. For conversion rate optimization (CRO), knowing precisely how far down a page visitors scroll is fundamental. Scroll depth analysis moves beyond vanity metrics, providing direct insight into content engagement and the visibility of critical conversion elements like calls-to-action (CTAs), forms, and value propositions. Without this data, optimizing page layout, content flow, and offer placement becomes guesswork, potentially leaving conversions on the table. This guide outlines how to effectively analyze scroll depth to inform your CRO efforts, ensuring your key messages and conversion points are seen and acted upon.
Setting Up Scroll Tracking
Accurate scroll depth data relies on robust tracking implementation. While platforms offer native capabilities, custom configurations often provide the granularity required for meaningful CRO insights.
Google Analytics 4 (GA4) Configuration
GA4 includes enhanced measurement for scroll events by default, tracking when a user scrolls 90% of the vertical length of a page. This provides a baseline understanding of deep engagement. However, for CRO, this 90% threshold is often insufficient. It doesn't tell you if users saw your primary CTA at 50% or your lead magnet form at 75%. While useful for broad content engagement metrics, relying solely on GA4's default scroll event limits the ability to pinpoint specific content sections or element visibility.
Google Tag Manager (GTM) for Custom Events
For precise scroll depth analysis, Google Tag Manager is indispensable. GTM allows you to define custom scroll triggers that fire at specific percentage thresholds (e.g., 25%, 50%, 75%, 90%) or, more powerfully for CRO, when specific elements become visible in the viewport. This element visibility trigger is crucial for understanding if users actually saw your headline, a key product feature, a testimonial block, or a conversion form. By pushing these custom events to GA4, you create a rich dataset that directly correlates user engagement with specific page components.
- Percentage-based tracking: Set triggers for 25%, 50%, 75%, and 90% to understand general page consumption patterns.
- Element visibility tracking: Configure triggers to fire when specific CSS selectors (e.g.,
#main-cta,.lead-form-section,#key-testimonial) enter the viewport. This is far more actionable than percentage-based tracking alone. - Scroll direction: GTM can also track scroll direction (up/down), which can indicate if users are re-engaging with content they've already passed.
Interpreting Scroll Depth Data
Raw scroll data is just numbers; its value emerges through careful interpretation, especially when linked to user behavior and conversion goals.
Identifying Drop-off Points
Visualize your scroll depth data using GA4's Explorations reports. A common approach is a funnel exploration or a path exploration, charting the percentage of users who reach each scroll threshold or element visibility event. A significant drop-off between, say, 50% and 75% scroll depth indicates a point where a large segment of your audience disengages. This could be due to content fatigue, a confusing section, or a lack of compelling information to continue. Identifying these points is the first step toward optimization.
Correlating Scroll with Conversions
The true power of scroll depth analysis for CRO lies in its correlation with conversion events. Did users who scrolled past your unique selling proposition (USP) section convert at a higher rate? Did those who saw your lead form (tracked via element visibility) submit it more often? By segmenting your conversion data by scroll depth events, you can quantify the impact of content visibility. For example, if users who scrolled 75% of a product page convert at 3x the rate of those who only scrolled 25%, it suggests that the content below the 25% mark is critical for building purchase intent.
Pro Tip: Do not analyze scroll depth in isolation. Always cross-reference scroll data with other engagement metrics like time on page, bounce rate, and click-through rates on internal links. A low scroll depth combined with a high time on page might indicate users are stuck or deeply engaging with content high up on the page, rather than disengaging.
Actionable Insights from Scroll Analysis
With data in hand, the next step is to translate observations into testable hypotheses and concrete optimizations.
Content Reordering and Optimization
If your scroll depth analysis reveals that a significant portion of your audience never reaches a crucial piece of information (e.g., benefits, testimonials, FAQs), consider moving that content higher on the page. Conversely, if a section consistently shows a sharp drop-off, investigate its content. Is it too long, confusing, or irrelevant? This might require condensing text, breaking it into smaller chunks, or even removing it if it doesn't contribute to the conversion journey.
Placement of Calls to Action (CTAs) and Forms
Scroll data directly informs optimal CTA and form placement. If your primary CTA is at the bottom of a long page and scroll depth indicates only 30% of users reach it, experiment with placing a secondary or "soft" CTA higher up, perhaps just after the 50% mark where engagement is still high. For forms, ensure they are visible at a point where user intent is likely highest, or strategically placed just before a significant drop-off to capture interest before it wanes.
A/B Testing Scroll-Driven Hypotheses
Scroll depth analysis is a diagnostic tool; A/B testing is the solution. Formulate hypotheses based on your findings: "Moving the product benefits section above the feature comparison will increase scroll depth to 75% and improve add-to-cart rates by 5%." Then, design A/B tests to validate these hypotheses. Track not only the primary conversion metric but also the custom scroll events in GA4 for both variations to confirm the impact on engagement.
Common Pitfalls and Data Accuracy
While powerful, scroll depth analysis has nuances that can affect data accuracy and interpretation.
- Dynamic Content: Pages with infinite scroll, lazy-loaded content, or single-page applications (SPAs) require specialized GTM configurations to accurately track scroll depth as the page length changes or new content loads.
- Device Differences: Scroll depth varies significantly between desktop and mobile. Always segment your data by device type, as a 50% scroll on mobile might represent a different content consumption pattern than 50% on a large desktop monitor.
- Viewport Size: Different screen resolutions mean the "bottom" of the page is not static. GTM's built-in scroll depth variable accounts for the total scrollable height, but interpreting the visual experience still requires context.
- Page Structure: Pages with large images, videos, or embedded elements can skew scroll percentages if not accounted for. Element visibility triggers are often more reliable for these scenarios.
Optimizing Engagement for Conversion Lift
Analyzing scroll depth moves you beyond superficial engagement metrics to understand true content consumption. By setting up precise tracking, interpreting drop-off points in conjunction with conversion data, and systematically testing layout and content changes, you can strategically optimize your pages. This iterative process of data collection, hypothesis generation, and A/B testing ensures that your most valuable content and conversion elements are seen, understood, and acted upon, ultimately driving measurable increases in your conversion rates.
Frequently Asked Questions
What is scroll depth?
Scroll depth measures how far down a web page a user scrolls, typically expressed as a percentage of the page's total vertical length or by tracking the visibility of specific elements.
Why is scroll depth important for conversion rate optimization?
Scroll depth reveals whether users are seeing critical content, calls-to-action, and forms. It helps identify where users disengage, allowing for optimization of content placement and page layout to improve conversion rates.
How accurate is scroll depth tracking?
Accuracy depends on implementation. While default tracking offers a general view, custom configurations via Google Tag Manager (GTM) for specific percentage thresholds or element visibility provide highly accurate and actionable data for CRO, especially on dynamic pages.
Can scroll depth data be used for SEO?
While primarily a CRO metric, scroll depth can indirectly inform SEO by indicating content engagement. Pages with high scroll depth suggest users find the content valuable, which can be a positive signal for search engines regarding content quality and user experience.