

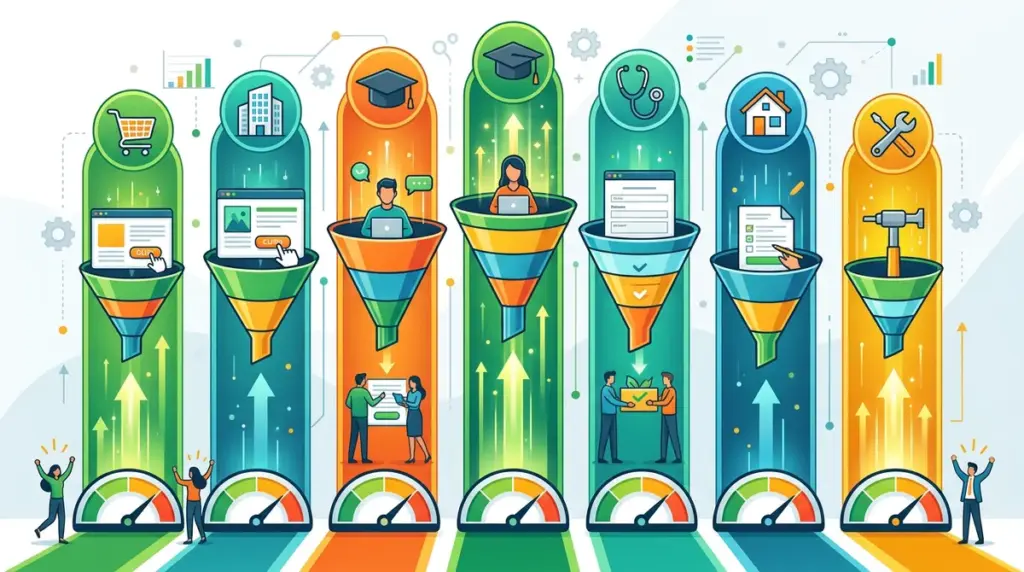
Chasing a "good" conversion rate is a dangerous game if you lack the context of your specific vertical. A 2% conversion rate might represent a scaling success for a luxury watch retailer with a $5,000 average order value, but for a low-friction lead magnet in the insurance space, that same 2% indicates a fundamental failure in the offer or landing page design. To move the needle, you must stop measuring against the global internet average and start measuring against the top 10% of your direct competitors.
The Baseline Reality of Modern Conversion Benchmarks
While the cross-industry average typically hovers between 2.35% and 5.31%, the elite performers—the top 10%—are often seeing conversion rates 3x to 5x higher than the mean. In high-intent categories like legal or finance, top-tier landing pages frequently break the 10% mark. The gap between "average" and "elite" is rarely about the product itself; it is almost always a result of friction reduction, offer alignment, and technical performance.
Key Metric: The "Top 10%" threshold is the only benchmark that matters for aggressive growth. If the industry average is 3%, your target should be 11.5% or higher to achieve a dominant return on ad spend (ROAS).
E-commerce and Retail Benchmarks
E-commerce conversion rates are notoriously volatile because they are sensitive to device type and seasonal shifts. On average, e-commerce sits at approximately 2.5% to 3%. However, this varies wildly by niche:
- Fashion and Apparel: 1.5% - 2.5%. High return rates and "window shopping" behavior on mobile devices suppress these numbers.
- Health and Wellness: 3.0% - 4.5%. Subscription models and repeat purchases often drive higher conversion rates here than in one-off retail.
- Consumer Electronics: 1.1% - 2.0%. Longer research cycles and high price points lead to more "touches" before a final conversion.
For DTC brands, the goal is to optimize the "Add to Cart" to "Purchase" flow. If your cart abandonment rate is over 70%, your industry-standard conversion rate is being throttled by checkout friction rather than poor top-of-funnel traffic.
B2B SaaS: Trial vs. Demo Conversions
In B2B SaaS, the definition of a "conversion" dictates the benchmark. A "Free Trial" signup will naturally convert at a higher rate than a "Request a Demo" CTA because the friction is lower and the immediate value is higher.
Best for Product-Led Growth: Free trial conversion rates typically range from 5% to 10% for organic traffic. If you are running cold paid traffic (LinkedIn or Google Search), expect this to drop to 2% to 5%.
Best for Enterprise Sales: Demo requests for high-ticket SaaS (contracts over $20k/year) usually hover around 1% to 3%. Because the sales cycle is longer, the landing page must focus on social proof and specific ROI case studies rather than "feature dumping."
Warning: Beware of "Blended Conversion Rates." If you mix your high-converting brand search traffic with your low-converting cold display traffic, you will get a useless average that masks the underperformance of your paid campaigns. Always segment benchmarks by traffic source.
Professional Services: Legal, Finance, and B2B Lead Gen
Lead generation for professional services often sees the highest conversion rates because the "offer" is usually a free consultation or a quote—low-risk actions for the user.
In the Legal industry, a good conversion rate is roughly 4% to 6%. Top-tier firms using localized landing pages and click-to-call buttons often see 15%+. For Financial Services, the average is closer to 5.1%, but high-intent keywords (e.g., "debt consolidation quotes") can push well above 10% if the form is optimized with multi-step logic.
Factors That Dictate Your Real Conversion Ceiling
Before you overhaul your design based on industry averages, consider the three primary variables that skew these numbers:
1. Traffic Intent and Source
Traffic from an "intent-based" Google Search query will always out-convert "disruption-based" social media traffic. If 80% of your traffic comes from Instagram ads, your conversion rate will naturally be lower than a competitor who relies on SEO for bottom-of-funnel keywords. You aren't losing; you're just playing a different game.
2. Offer Friction
A 12-field form requesting a phone number and company revenue will convert at a fraction of the rate of a 3-field form. If your industry average is 5% but you require a credit card upfront for a trial, your "low" 2% might actually be an over-performance in terms of lead quality.
3. Mobile vs. Desktop UX
Desktop conversion rates are consistently 2x to 3x higher than mobile across almost every industry. If your site has a "mobile-first" audience (common in B2C), your blended conversion rate will look lower than a B2B site where 90% of users are on a desktop at work.
Translating Benchmarks into a Growth Strategy
To move from the industry average to the top 10%, you must shift from cosmetic changes to structural funnel optimizations. This involves auditing the "distance to value." How many clicks does it take for a user to realize the benefit of your offer? In the B2B space, this often means replacing a static "Contact Us" page with an interactive calculator or a gated piece of proprietary data. In E-commerce, it means implementing one-click checkouts and dynamic social proof that updates in real-time based on the user's location.
Stop looking at your conversion rate as a static percentage. View it as a reflection of your offer's relevance to the specific segment of traffic you are buying. If you are below the 2% mark in any lead-gen category, you likely have a technical "leak" (slow load times) or a "trust gap" (lack of visible authority signals).
Frequently Asked Questions
What is a good conversion rate for Google Ads?
Across all industries, the average is roughly 3.75%. However, for high-intent industries like Legal or Home Services, you should aim for 6% to 12% by using dedicated, keyword-specific landing pages rather than your homepage.
Why is my conversion rate lower than the industry average?
The most common culprits are slow page load speeds (anything over 2.5 seconds kills mobile CVR), a lack of mobile optimization, or "Offer Mismatch," where the ad promises one thing and the landing page delivers another.
Does a higher conversion rate always mean more profit?
No. You can "buy" a high conversion rate by lowering your prices or removing all qualifying questions from your forms. This often leads to lower margins or a sales team overwhelmed by low-quality leads. The goal is "Qualified Conversion Rate," not just raw volume.
How often should I benchmark my rates?
Monthly. Seasonality affects every industry. Comparing your December conversion rate to your July rate is often less productive than comparing your current rate to the same month in the previous year.